Your brain is made of maps
The cortex has a surprisingly simple organizing principle.
Neurons aren’t arranged at random. In some areas of the cortex (the mitten-shaped section we normally just think of as “the brain”), neurons are laid out in maps based on the properties of stimuli to which they respond. The response patterns of the neurons change systematically as you move across the cortical sheet. Where a neuron is located within a region predicts what information it will best process.
In short, the brain has a “topographic principle.”
The simplest example of a brain map is the primary auditory cortex, the first part of the cortex to process sound.
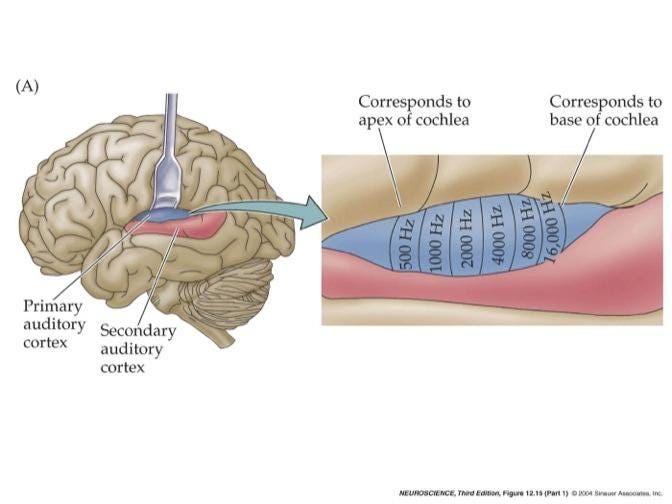
The auditory cortex’s “job” is to start the process of translating stimuli (sound waves) into meaningful information about the world (loudness, pitch, distance, rhythm, timbre, presence of speech or music, etc). The signals it receives originate in the cochlea in the inner ear, which is shaped to gradually vary in thickness such that one end vibrates the most and transmits signals to the brain in response to high-pitched sounds, and the other end for low sounds.
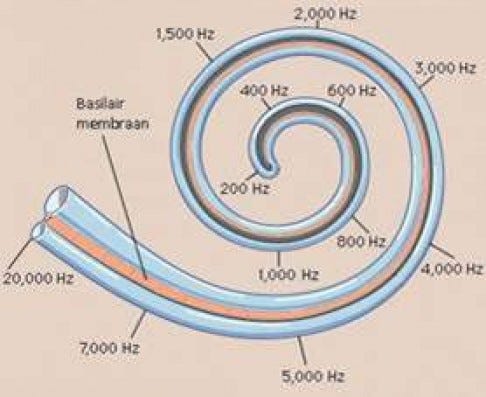
The auditory cortex organizes itself in the same way, creating a map where the farther you move along the cortical sheet, the higher the pitch to which neurons best respond*1. This organization of brain tissue by response to pitch is called a “tonotopic” arrangement.*2
The primary visual cortex is also arranged topographically. However, it is a radial map rather than a linear map, organized based on where a stimulus falls relative to the center of the circular retina. Many cells in different parts of the retina transmit information to the visual cortex, allowing it to determine, based on which cells relayed the signal, where in the retina a signal came from. So the visual cortex is a “retinotopic” map. Because the location of a signal in the retina corresponds to its position in the visual field, this retinotopic map also maps the visual field.
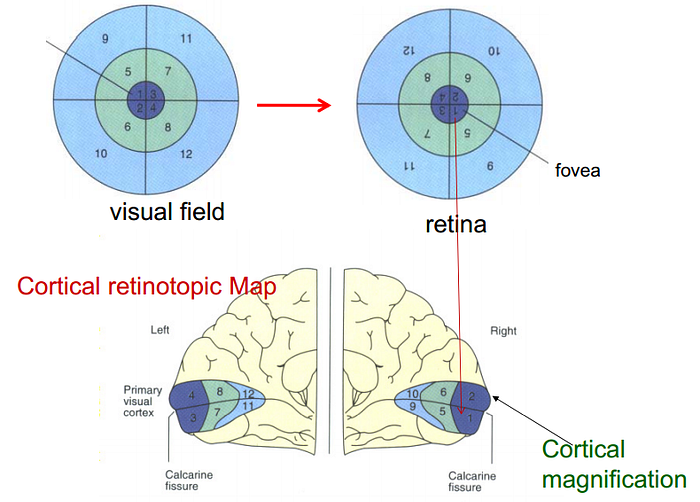
Aside you may want to skip if in a hurry: (As shown in the image, an added complication occurs: the information from the left retina goes to the right hemisphere and information from the right retina goes to the left hemisphere, creating two retinotopic maps. These adjoin each other, as the visual cortex wraps around the back of the brain).
The retinotopic map illustrates a second principle of brain organization:
More cortical space will be dedicated to processing important information than less important information.
(This is called cortical magnification.) In other words, the amount of space a brain map dedicates to a stimulus reflects its usefulness rather than its real physical properties.
The equivalent, in terms of real world maps, might be a U.S. map that based the size of other countries on the friendliness of its relations with them. In such a map, the U.K. and Israel would be disproportionately large, and China disproportionately small.
In the visual cortex, cortical magnification is greatest for information coming from the center of the retina, and diminishes with eccentricity (distance from the center).
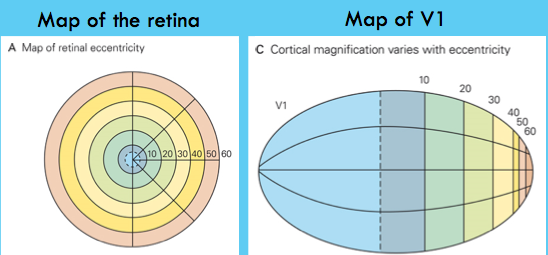
Cortical magnification increases the space dedicated to processing the center of the retina because this is the area of most acute, detailed vision.
The most interesting maps in the brain

This creature isn’t a caricature of an ancient humanoid or alien species. It is a 3-D model of your brain’s map of your own body, called the “sensory homunculus.”
We normally think of maps as illustrating the space outside our bodies. But the body is also a space that can be mapped, and your brain needs to chart it to make sense of the world. That way, when somebody taps you on the shoulder, you feel that the pressure comes from your shoulder, not your knee. Your brain also uses information from your internal organs to create its body map, allowing you to tell the difference between a sharp pain in your abdomen and your chest.
Your somatosensory cortex maps out your body space, primarily based on touch.
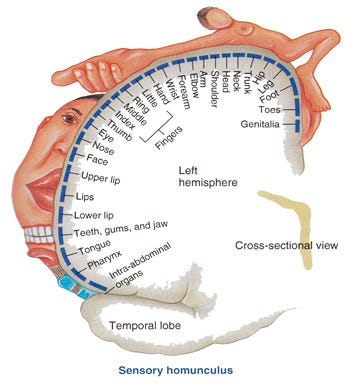
The location of the body parts within the map is less continuous than you might expect after seeing the visual and auditory cortical maps, but they follow a certain logic. Notice that the overall shape of the body from feet to head to hands is arranged in a continuous order, but important regions with large numbers of nerve endings get their own separate space. These include the face and its features; tongue and pharynx; abdominal organs; and genitals. These, too, are placed in a “logical” position relative to the body schematic and to each other. For example, the genitalia are located close to the legs and feet, just as in real life. The lips, teeth, gums, jaw, and tongue are together and neighbor the pharynx, which works with them, and the rest of the face, where they are located. The intra-abdominal organs are next to the pharynx, perhaps because they work together during eating.
These important features also take up way more cortical space in the map, and look comically big in the 3D homunculus, because they have undergone drastic cortical magnification. Your fingertips need to be more sensitive than your back, so they not only have denser nerve endings, but they also take up more processing space in your brain’s body map.
Your motor cortex, which commands your muscles to move, also has a body map. Thanks to cortical magnification, it has a slightly different, but equally ridiculous-looking, homunculus.
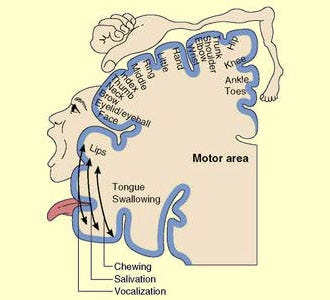
The motor map of your body follows the same principles as the somatosensory one — an overall continuous body map with separate cortically magnified areas for key organs.*3 However, it looks even more distorted because your torso and arms barely feature at all.
Plastic Maps
A classic study of string musicians suggests that the brain’s maps change with experience. Specifically, cortical magnification shifts, with frequently-used parts of the map expanding into neighboring space, and underused ones shrinking.
Thomas Elbert and colleagues examined the somatosensory cortex of string players because they use their left hand extensively and precisely for fingering, especially their 2nd through 5th fingers, but their right hand much less. Thus, one might expect to see changes in the maps for their left hands. They applied light pressure to the first and fifth digit of each hand to locate the hand somatosensory maps and found that the musicians’ center of responsivity for the left was not only stronger than non-musicians’, but had also shifted along the cortical surface. The authors argued that the musicians devoted more space in their body map to the left hand, strengthening and shifting the center of response. By contrast, the right hand maps of musicians and non-musicians did not differ.
The age at which musicians started playing correlated with the magnitude of these brain changes: the more experience they had playing string instruments, the greater the cortical magnification. This correlation is more informative than an absolute difference between musicians and nonmusicians because it increases the likelihood that group differences came from different experiences using their left hands, and not from other differences in genetics or upbringing.
This study, conducted at the dawn of fMRI in 1995, used the primitive imaging and analysis techniques of the day. However, it spawned a line of research on the effects of long-term instrument playing on sensory and motor maps, using ever more sophisticated methods. Changes over time have been observed in children learning a musical instrument. The effects may be both structural and functional, and likely go beyond the simple changes in cortical magnification I’ve discussed here.
Three Key Principles of Brain Organization
These examples illustrate three crucial principles of brain organization:
1. Your brain creates “maps” where things that are more similar are located close together, and things that differ are located farther away.
2. Stimuli that are more important take up more space in the map than stimuli that are less important.
3. Experience can change the distribution of how neurons within the map respond to specific stimuli.
These principles matter because they draw a link between where things happen in the brain and what the brain actually does. Where things happen is easy to measure, but uninformative when considered alone. Thus, neuroscientists consider figures showing blobs of activity on brains with descriptions like “your brain on x” to be meaningless. On the other hand, we can’t directly measure what we really want to know — the processes the brain carries out (although we can measure the resulting behavior).
Topographic organization does not explain everything the brain does, and better fits some regions than others. But it describes a meaningful, predictable relationship between what the brain does and where this activity occurs. Better still, these relationships are intuitive and, with a little oversimplification, easy to visualize.
Next time you read a news article describing the locations of important brain functions or neuroscientists’ critiques of this sort of study, keep in mind these three principles of mapping in the brain.
Notes:
- I say “best respond” here because neurons follow a “tuning curve.” A specific stimulus (such as a frequency of light or sound) evokes the maximal response in that neuron. However, a frequency that is only slightly higher or lower will also evoke a response — a slightly weaker one. The closer a stimulus is to the one the neuron is “tuned” for, the stronger the response; the less similar, the lower the response.
- As taught in undergraduate and graduate neuroscience textbooks, the primary auditory cortex as a whole is one single continuous tonotopic map. However, this is an oversimplification. There appear to be six separate tonotopic maps within the human auditory cortex, arranged in an intermingled and nonlinear way.
- Note that this map occurs at a very high level. Alan H.D. Watson observes that “although the region of motor cortex controlling the hand is relatively easy to define, the representations of the muscles moving different fingers or individual joints overlap to a considerable degree.”
References
Thomas Elbert, Christo Pantev, Christian Wienbruch, Brigitte Rockstroh, & Edward Taub (1995). Increased cortical representation of the fingers of the left hand in string players. Science vol. 270, pp. 305–307. Open access PDF.
Krista L. Hyde, Jason Lerch, Andrea Norton, Marie Forgeard, Ellen Winner, Alan C. Evans, & Gottfried Schlaug (2009). The effects of musical training on structural brain development: A longitudinal study. The Neurosciences of Music III: Disorders and Plasticity: Ann. New York Academy of Sciences 1169, pp. 182–186. Open access PDF. Quick and easy read as fMRI studies go; about 3 pages of text.
Further Reading:
Review of research on how musical training changes auditory cortex: Christo Pantev & Sibylle C. Herholz (2011). Plasticity of the human auditory cortex related to musical training. Neuroscience & Behavioral Reviews vol. 35, pp. 2140–2154. Open access PDF.
On gray matter changes in musicians’ auditory cortex: Patrick Bermudez, Jason P. Lerch, Alan C. Evans, & Robert J. Zatorre (2008). Neuroanatomical correlates of musicianship as revealed by cortical thickness and voxel-based morphometry. Cerebral Cortex vol. 19 iss. 7, pp. 1583–1596. Free full text.
How children’s motor and auditory cortices change over 15 months of musical training: Krista L. Hyde, Jason Lerch, Andrea Norton, Marie Forgeard, Ellen Winner, Alan C. Evans, & Gottfried Schlaug (2009). Musical training shapes structural brain development. Journal of Neuroscience vol. 29 iss. 10, pp. 3019–3025. Open access PDF.
Fancy resting state methods used to study musicians’ brain changes: Cheng Luo, Zhi-wei Guo, Yong-xiu Lai, Wei Liao, Qiang Liu, Keith M. Kendrick, De-zhong Yao, & Hong Li (2012). Musical training induces functional plasticity in perceptual and motor networks: Insights from resting-state fMRI. PLoS ONE vol. 7 iss. 5, e36568. Open access PDF.
Playing string instruments involves asymmetrical hand use, which makes motor cortex more asymmetrical: Peter Schwenkreis, Susan El Tom, Patrick Ragert, Burkhard Pleger, Martin Tengenthoff, & Hubert R. Dinse (2007). Assesment of sensorimotor cortical representation asymmetries and motor skills in violin players. European Journal of Neuroscience vol. 26, iss. 11, pp. 3291–3302. Open access PDF.
Paper referenced in Note 2: Thomas M. Talavage, Martin I. Sereno, Jennifer R. Melcher, Patrick J. Ledden, Bruce R. Rosen, & Anders M. Dale (2004). Tonotopic organization in human auditory cortex revealed by progressions of frequency sensitivity. Journal of Neurophysiology vol. 91 no. 3, pp. 1282–1296. Free full text.
Paper referenced in Note 3: Alan H.D. Watson (2006). What can studying musicians tell us about motor control of the hand? Journal of Anatomy vol. 208 iss. 4, pp. 527–542. Free full text.
